How to Interpret and Apply Current – Temperature Derating Curve
The purpose of the current-temperature derating test is to assess the current carrying capacity of the contact under test at elevated ambient temperatures. The testing is done in accordance with IEC 60512-5-2 (Test 5b).
Current-Temperature Derating Curve Definition
The current carrying capacity of a contact is limited by the thermal properties of the materials used, a derating curve represents the relationship between the self-heating properties of the contact and the ambient temperature. A material with higher thermal properties will heat at a slower rate and enable the contact to be used at higher ambient temperatures. The chart below shows a typical example of a derating curve and will be referred to throughout this document.
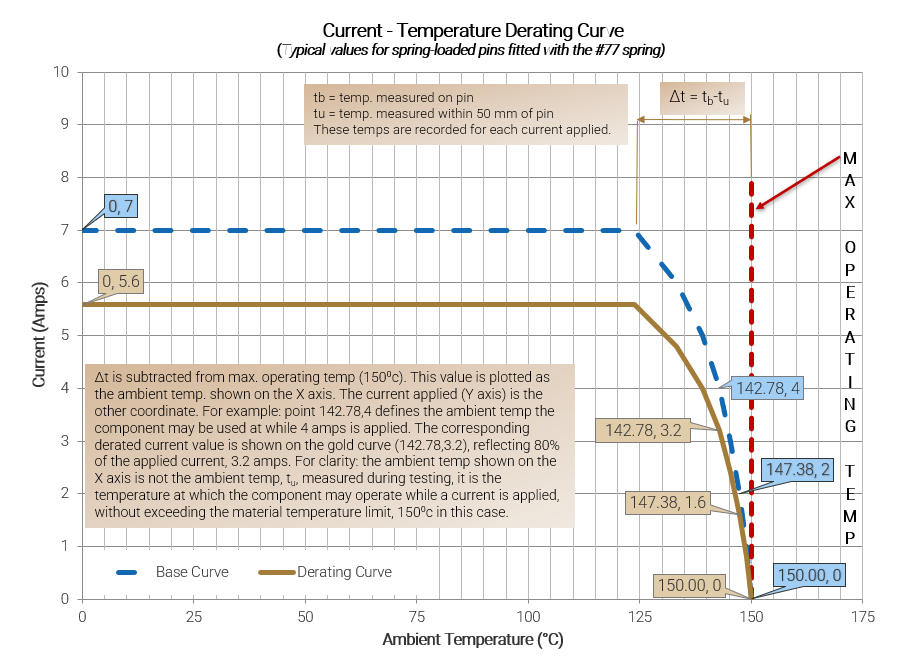 |
The first thing to clarify is how the term ambient temperature is used in relation to the derating curve. There are two uses of the term ambient temperature: there is the ambient temperature (tu) which is a measurement taken in close proximity (within 50 mm, approx. 2”) to the contact being tested, this is monitored throughout the test; and there is the maximum ambient temperature, which is calculated from measurements taken and plotted as the X-axis coordinates on the curve.
The ambient temperature on the X axis is the maximum temperature at which the tested component may be used when the corresponding current is applied. The maximum ambient temperature is calculated as: Tmax - ∆t.
Where Tmax = Max operating temperature of the material (represented as a vertical line on the X-axis) and ∆t = tb- tu (tb= temperature measured on component; tu= ambient temperature measured within proximity of component)
Current-Temperature Derating Curve Process
The process is as follows: apply the current, measure the temperature on the component, then subtract the monitored ambient proximity temperature, this is the temperature rise. Then subtract this from the max operating temp of the material and plot it as the X value. Plot the corresponding applied current on the Y axis. The base curve is generated from the data and the derated curve represents 80% of the base curve. This derating is necessary to account for variation in the specimens as well as errors in temperature measurements in the measuring equipment.
The procedure does not test parts to failure. In properly functioning parts the max operating temperature of the contact material is never approached. For example, if the ambient temperature (tu) being monitored during testing was in the range of 20 to 24⁰ C and the ∆t reached 20⁰ C that would correspond with a component temperature (tb) of 40 to 44⁰ C, well below the max operating temperature of the material, 150⁰ C in this case.
The IEC 60512-5-2 test specification calls for a minimum of three points to establish the basic curve, more data points may be used as shown in the graph above. The current is maintained for 1 hour after thermal stability is achieved at each of the selected current levels. Thermal stability is defined as when three consecutive values of temperature rise, taken at 5-minute intervals, do not differ by more than 2⁰ C of each other.
The graph above shows the relationship between the max operating temperature of the material, the current applied and the ambient temperature. As the current applied is increased, the ambient temperature the part may be used at decreases. Per the base curve of the graph, at 147.38⁰ C ambient temperature, the max current that can be applied is 2 amps. However, the derating curve reduces the current to 1.6 amps at that same temperature to account for manufacturing and testing variances. The area under the derating curve is the recommended operating range and should be used for determining suitability for a given application. The base curve shows the absolute maximum ability of the part and therefore has no safety factor built in.
Current-Temperature Derating Test
Shown below are typical data generated from a current-temperature derating test.
| Current (A) | tb Component Temp. (°C) | tu Ambient proximity temp. (°C) | ΔT (tb-tu) (°C) | Max Ambient Temp; (X axis) Tmax - ∆T (°C) | Derated Current (A) |
|---|---|---|---|---|---|
| 0 | 24.41 | 24.41 | 0.00 | 150.00 | 0 |
| 1 | 25.53 | 24.41 | 1.12 | 148.88 | 0.8 |
| 2 | 27.22 | 24.6 | 2.62 | 147.38 | 1.6 |
| 3 | 29.61 | 24.83 | 4.78 | 145.22 | 2.4 |
| 4 | 32.43 | 25.21 | 7.22 | 142.78 | 3.2 |
| 5 | 36.38 | 25.5 | 10.88 | 139.12 | 4 |
| 6 | 42.68 | 25.92 | 16.76 | 133.25 | 4.8 |
| 7 | 52.63 | 26.33 | 26.30 | 123.70 | 5.6 |
